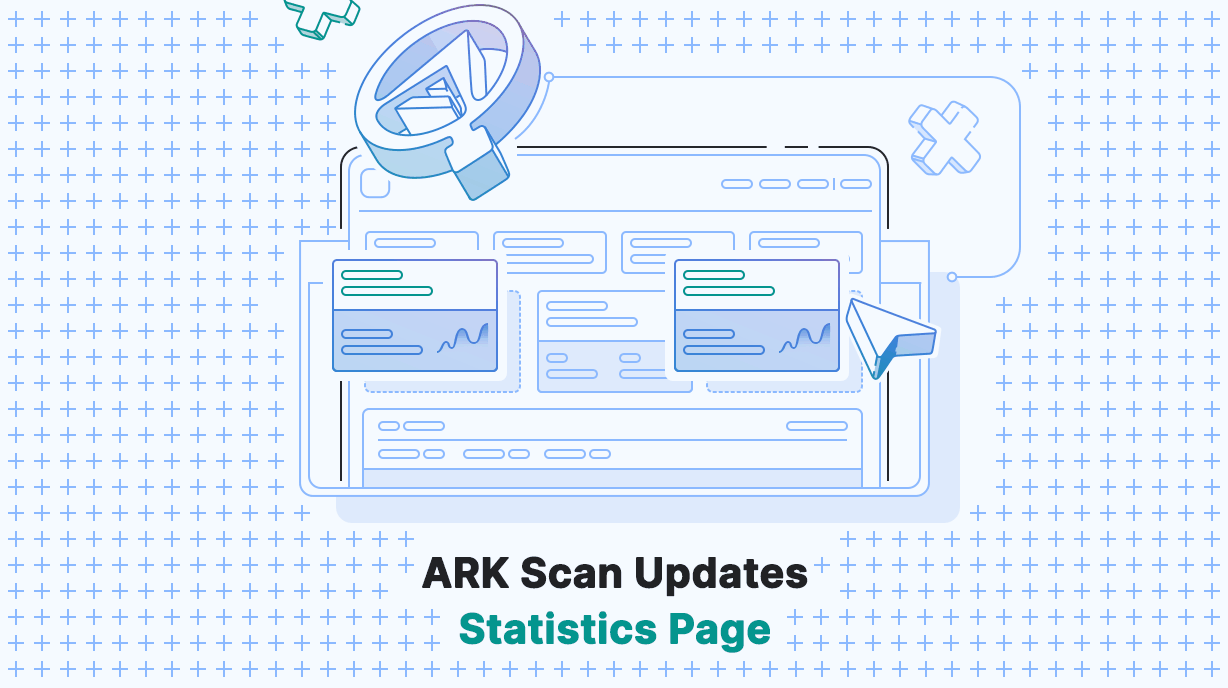
This week, we unveiled a refreshed version of ARK Scan. The Statistics page has been redesigned for seamless consistency with other pages. Furthermore, we’ve enhanced the navigation bar, ensuring a more intuitive and streamlined experience when switching between networks.
The updated statistics page maintains the original dataset while introducing improvements in user experience and an overall design transformation.
Information Boxes

- Total Supply: Displays the current total supply.
- Voting (%): Reveals the total ARK tokens currently engaged in voting and expresses this as a percentage of the total supply involved in voting.
- Delegates: Indicates the number of registered delegates on the blockchain. We’ve added a ‘View All’ option that links to a dedicated delegates page for further information.
- Wallets: Shows the number of wallets that have interacted on the blockchain (at least one incoming transaction). We’ve also included a ‘View All’ link, directing users to a dedicated ‘Top Accounts’ page displaying all wallets.
Blockchain Data

In this section, users can access crucial blockchain data and obtain current fees for different transaction types.
- All-Time Transactions: Reveals the total number of transactions included in the blockchain. Below, users can access different timeframes and the number of transactions during those periods.
- Current Average Fee (Transaction Type): Displays the current average fee for various transaction types. Users can switch between transaction types via the dropdown and view the minimum and maximum fees paid for each type along with the current average fee for the type.
- All-Time Fees Collected: Shows the total fees collected for all transactions. Below, users can access different timeframes and the fees collected during those intervals.
Chart
We’ve updated the chart, which is also presented on the homepage, providing more information and a larger size.

Users can view the current price in the upper left corner based on their selected currency, along with the price change in percentage. On the right, we’ve added a quick link to the ‘Exchanges’ page, listing platforms where ARK can be traded.
On the graph, you’ll find:
- Market Cap: Shows the current market cap of ARK.
- Min Price: Indicates the minimum price at which ARK was exchanged in the selected currency.
- Max Price: Displays the maximum price at which ARK was exchanged in the selected currency.
- Timeframe: Allows users to select different timeframes based on their preferences.
Hovering over the chart reveals exchange rates at various points in time.
Updated Network Selector

We’ve also enhanced the network selector to be more user-friendly. Previously, it consisted of just an ARK icon, which didn’t provide clarity until clicked. Now, the name of the network you are currently exploring is visible at all times, and you can easily switch between the ‘Mainnet’ (live network) and ‘Testnet’ (development network) of the ARK blockchains by clicking on the dropdown.
For a comprehensive changelog of this release, please visit GitHub .
What’s Next
Our next steps involve updating the designs on the ‘Delegate Monitor’ to align them with other pages, as well as addressing reported issues from the past week. Furthermore, we will implement suggested enhancements to the statistics page’s graph.
Follow Us On ‘X’
Follow us on X and keep checking the blog to stay up-to-date on all of our new releases. We post a weekly development report so you can easily see what we’ve been up to and follow along our journey towards making your decentralized future a reality.


